Viewing the Hardware Status
Status tabs are found at the bottom of the work space/data display field.
- Certain status tabs only appear when its corresponding feature is accessed or enabled.
- Mouse over a tab to have that tab's window open in the work space/data display field.
- Mouse onto the window and you can review the information within.
- Mouse off the window and the window closes.
- Click on the push-pin icon in the upper right of the window to "pin" that window and have it stay open when you mouse off. Click on the push-pin icon again to "un-pin" the window.
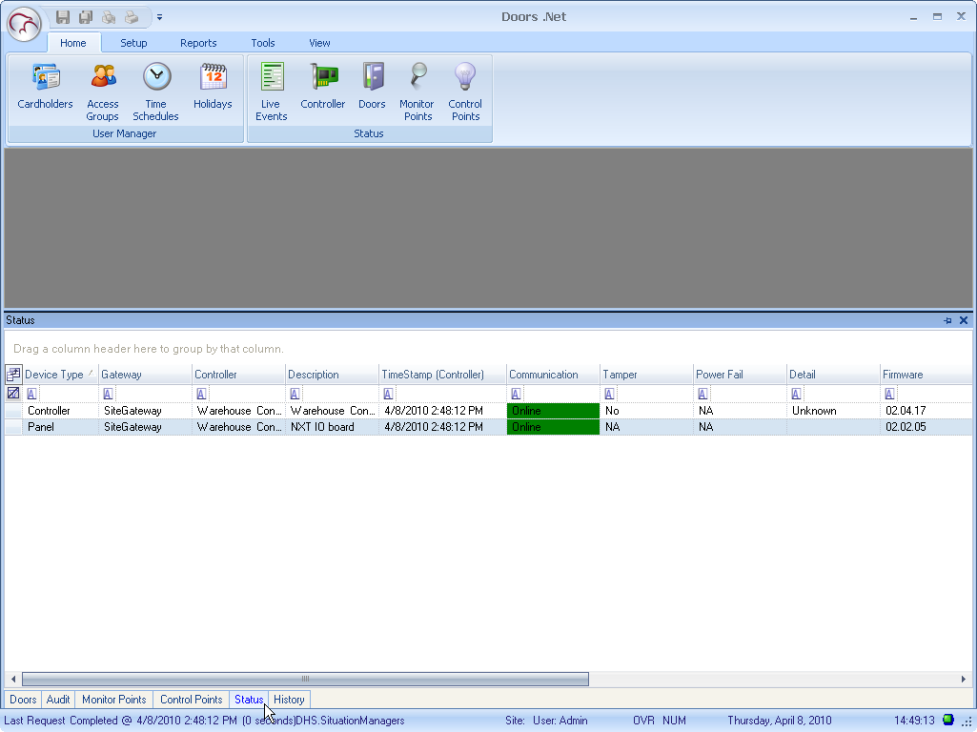
The example above displays the Status tab. Each tab has unique data sets.
- Alerts - lists events that require acknowledgment by an operator
- Control Points - lists information on all control points (outputs)
- Doors - lists information on doors
- Live Events - lists transactions in real-time
- Monitor Points - lists information on all monitor points (inputs)
- Status - lists controller status
- Trace Events - lists events specifically designated for display by the operator